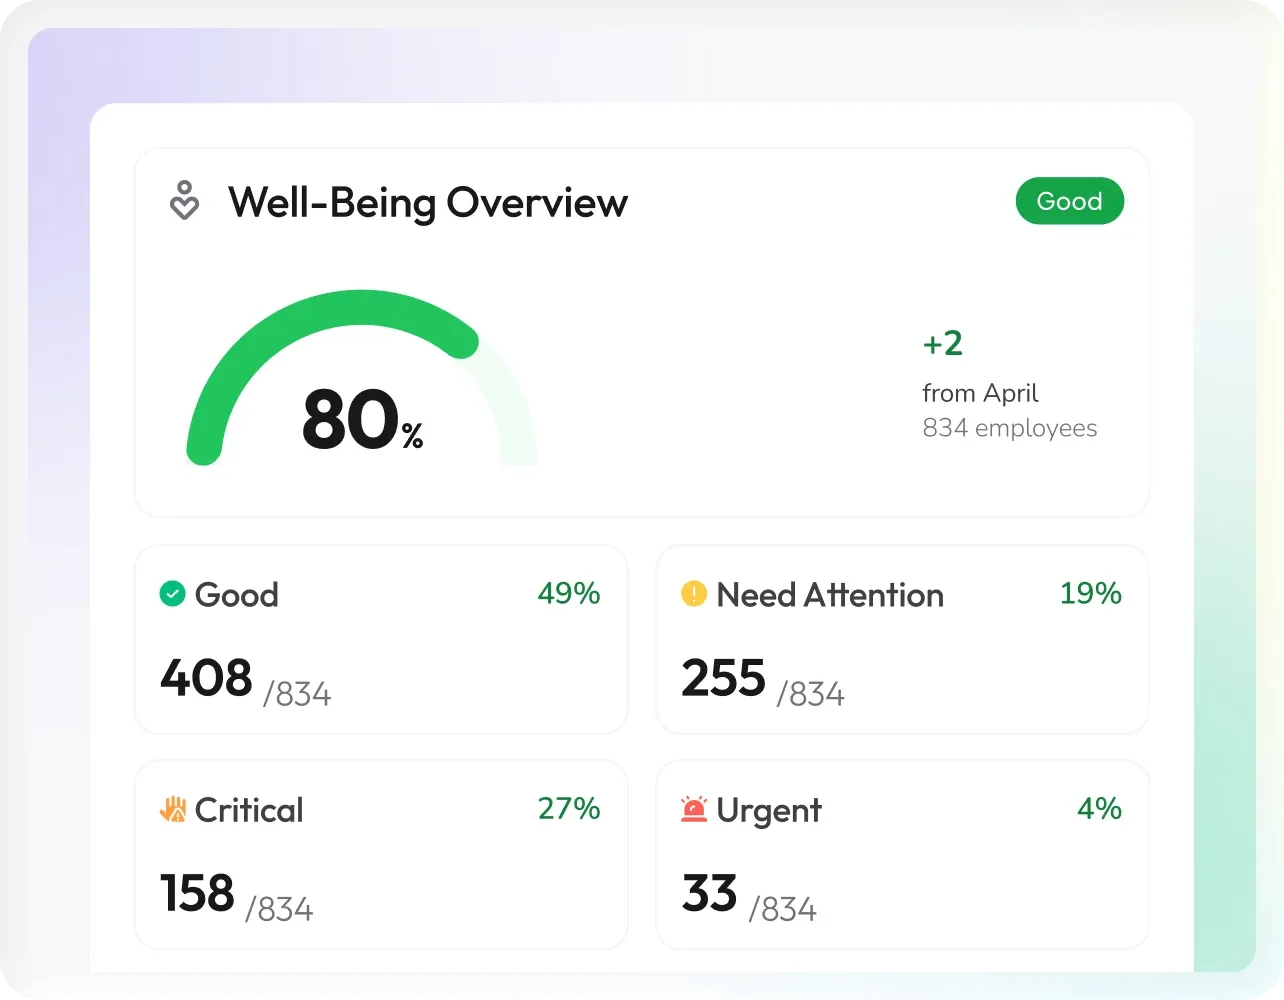
A Health Dashboard Communicating Data
Combine mood, survey results, and HRIS indicators to help HR spot engagement issues before resignations.
Combine mood, survey results, and HRIS indicators to help HR spot engagement issues before resignations.
Data Relations
Your HRIS data flows through Jenjang and helps your team make better decisions.
Key Metrics
Each metric is drawn from real data sources, complete with example insights that typically appear on the HR dashboard.
How likely employees are to recommend the company as a place to work
Example insight:
eNPS dropped 12 points after flexible working policy changed. HR intervened within the week.
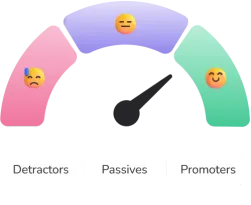
Average score of employee emotional state from daily check-ins.
Example insight:
Operations team dropped 0.8 points this week

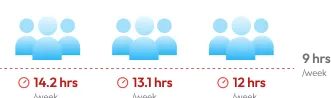
Early detection of excessive overtime patterns that risk burnout.
Example insight:
3 teams flagged for > 12 hrs/week overtime
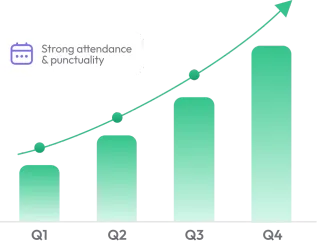
Consistency of attendance & punctuality.
Example insight:
Sales team discipline index rose to 8.6/10
From Signal to Action
Once a signal crosses a threshold, the system automatically recommends a relevant follow up action to the related module.
Burnout signal turn into a personalized development plant
Emotional risk signals trigger support recomendation
Real Insight Example
From early warnings to positive momentum your Well being dashboard surfaces both.
Key Features
Know before it escalates. Signals combine across mood, survey, and attendance surfaced before anyone has to report a problem.
No interpretation required. Every signal connects directly to an action IDP, counseling, or a manager flag automatically.
One bad week looks different from three declining months. Jenjang shows the pattern, not just the moment.
FAQ
Jenjang's well-being dashboard brings mood, survey results, and HRIS signals together in one clear view, so HR can read employee engagement and act on it early.
135 K+
Registered Users
183 K+
Assessments Completed
1 M+
People Data Points